Project 1: Do Manual Cars Have Better Mileage Than Automatic Cars?
Objective
In this lab session, we will explore whether cars with manual transmissions have better fuel efficiency (mpg) than cars with automatic transmissions. We will use the mtcars dataset to:
- Perform data wrangling.
- Carry out exploratory data analysis (EDA).
- Conduct a t-test to compare fuel efficiency.
- Check normality assumptions using Q-Q plots.
The dataset includes:
mpg: Miles per gallon (fuel efficiency).am: Transmission type (0 = automatic,1 = manual).- Other car attributes like horsepower (
hp) and weight (wt).
Step 1: Load Libraries and Dataset
library(tidyverse)

# Load the mtcars dataset and convert 'am' to a factor for clarity
data <- mtcars %>%
  mutate(am = factor(am, levels = c(0, 1), labels = c("Automatic", "Manual")))

# Display the first few rows of the dataset
head(data)
Step 2: Data Wrangling
# Check the structure of the data to verify 'am' is now a factor
str(data)
## 'data.frame': 32 obs. of 11 variables:
## $ mpg : num 21 21 22.8 21.4 18.7 18.1 14.3 24.4 22.8 19.2 ...
## $ cyl : num 6 6 4 6 8 6 8 4 4 6 ...
## $ disp: num 160 160 108 258 360 ...
## $ hp : num 110 110 93 110 175 105 245 62 95 123 ...
## $ drat: num 3.9 3.9 3.85 3.08 3.15 2.76 3.21 3.69 3.92 3.92 ...
## $ wt : num 2.62 2.88 2.32 3.21 3.44 ...
## $ qsec: num 16.5 17 18.6 19.4 17 ...
## $ vs : num 0 0 1 1 0 1 0 1 1 1 ...
## $ am : Factor w/ 2 levels "Automatic","Manual": 2 2 2 1 1 1 1 1 1 1 ...
## $ gear: num 4 4 4 3 3 3 3 4 4 4 ...
## $ carb: num 4 4 1 1 2 1 4 2 2 4 ...Question 1: How many cars in the dataset have automatic transmission, and how many have manual transmission?
# Count the number of cars by transmission type
table(data$am)
##
## Automatic Manual
## 19 13Step 3: Exploratory Data Analysis (EDA)
Summary Statistics
# Calculate summary statistics by transmission type
summary_stats <- data %>%
group_by(am) %>%
summarise(
count = n(),
mean_mpg = mean(mpg),
sd_mpg = sd(mpg)
)
# Display the summary statistics
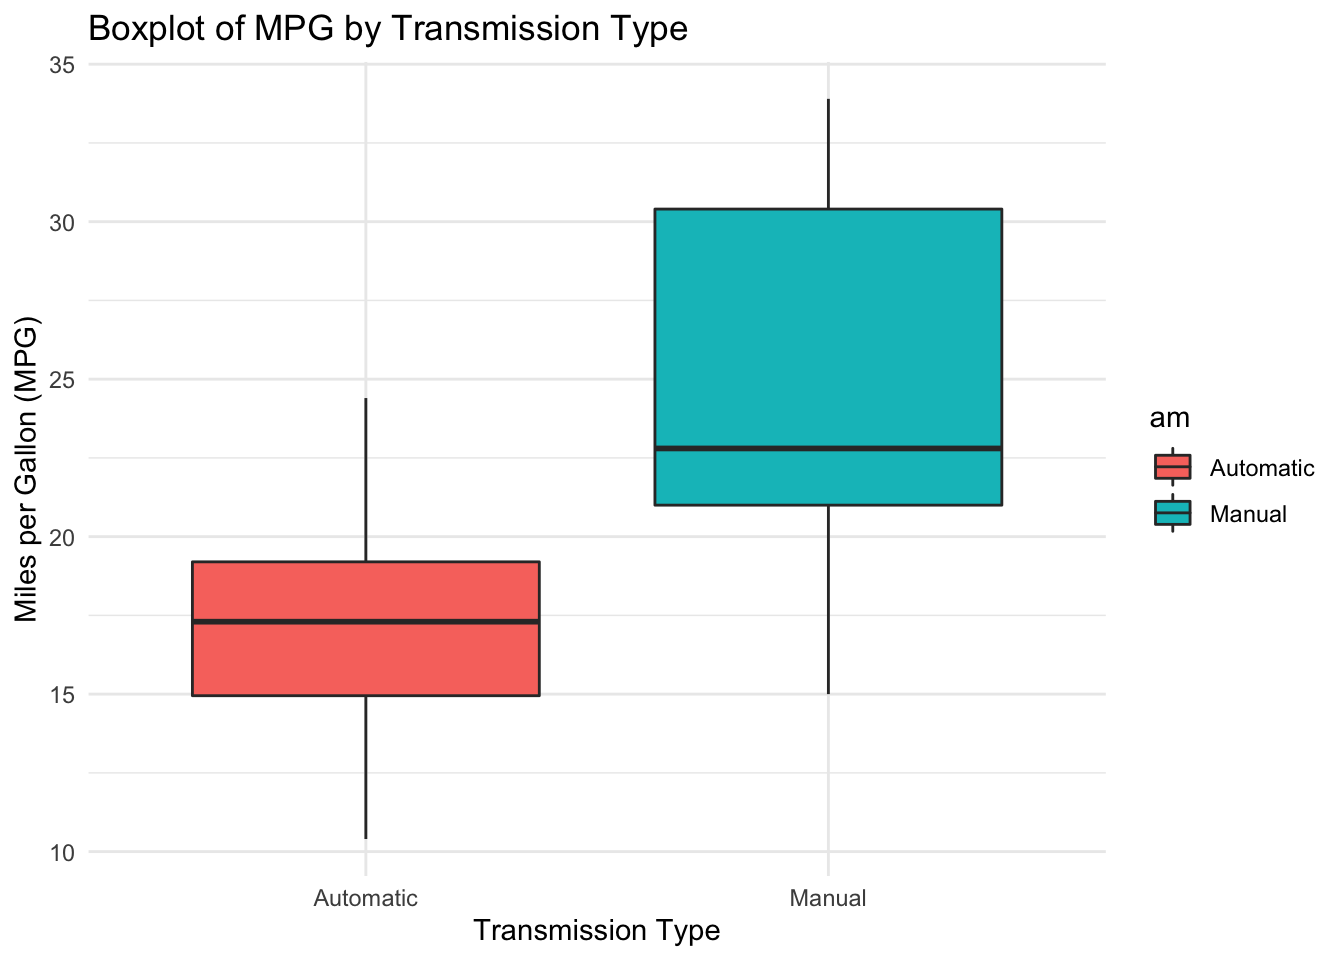
summary_statsBoxplot of MPG by Transmission Type
# Boxplot of mpg by transmission type
ggplot(data, aes(x = am, y = mpg, fill = am)) +
  geom_boxplot() +
  theme_minimal() +
  labs(
    title = "Boxplot of MPG by Transmission Type",
    x = "Transmission Type",
    y = "Miles per Gallon (MPG)"
  )
Step 4: Hypothesis Testing
State the Hypotheses
- Null Hypothesis (H0): No significant difference in mean mpg between automatic and manual cars.
- Alternative Hypothesis (Ha): Significant difference in mean mpg between the two transmission types.
Normality of the Data
# Create separate data frames for automatic and manual cars
data_auto <- data %>% filter(am == "Automatic")
data_manual <- data %>% filter(am == "Manual")

# Q-Q plot for automatic cars
ggplot(data_auto, aes(sample = mpg)) +
  geom_qq() +
  geom_qq_line() +
  ggtitle("Q-Q Plot for Automatic Cars") +
  theme_minimal()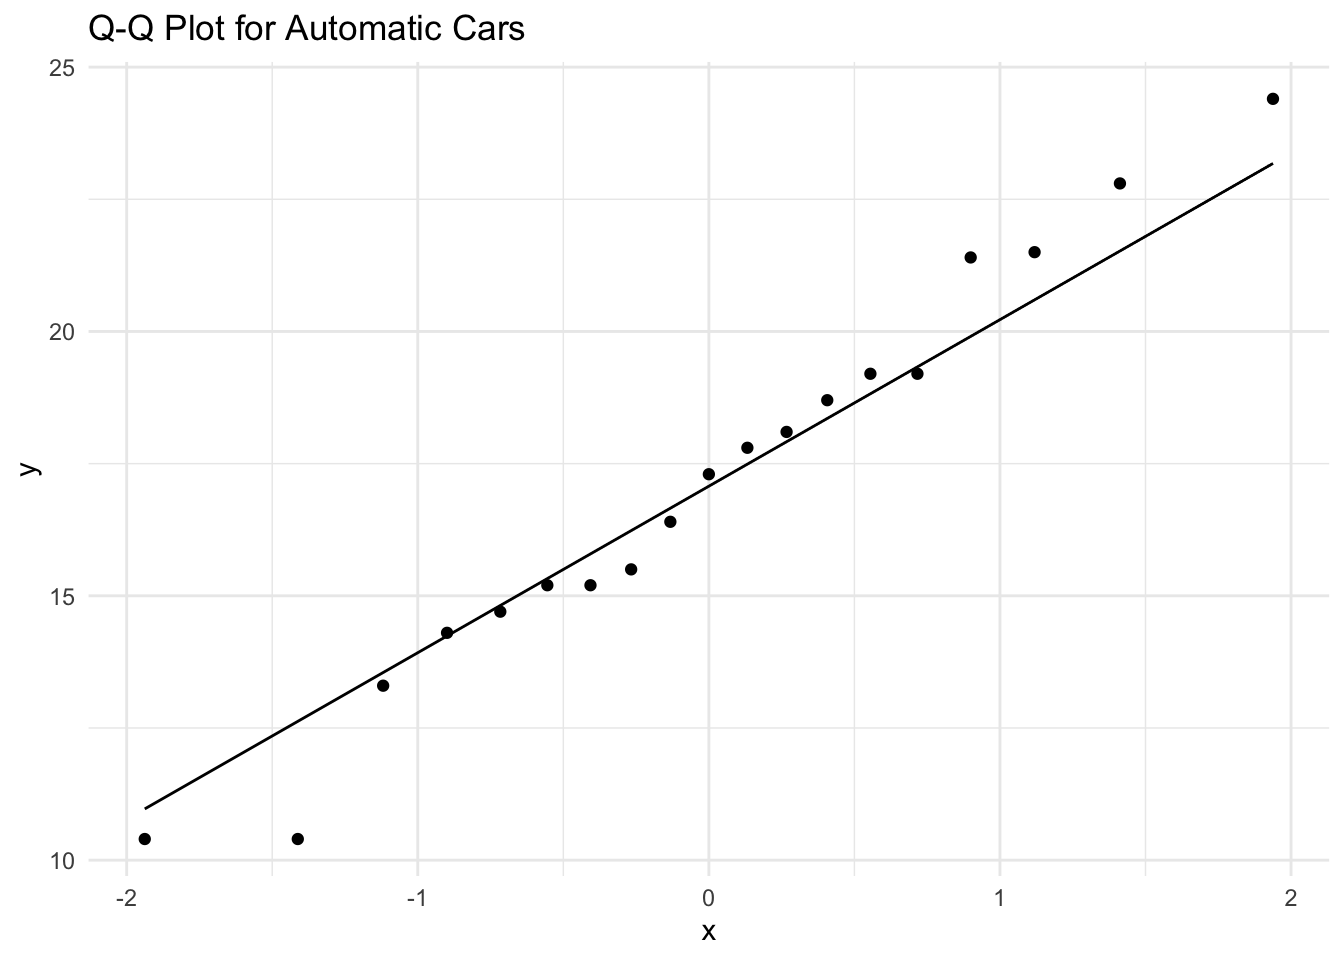
# Q-Q plot for manual cars
ggplot(data_manual, aes(sample = mpg)) +
  geom_qq() +
  geom_qq_line() +
  ggtitle("Q-Q Plot for Manual Cars") +
  theme_minimal()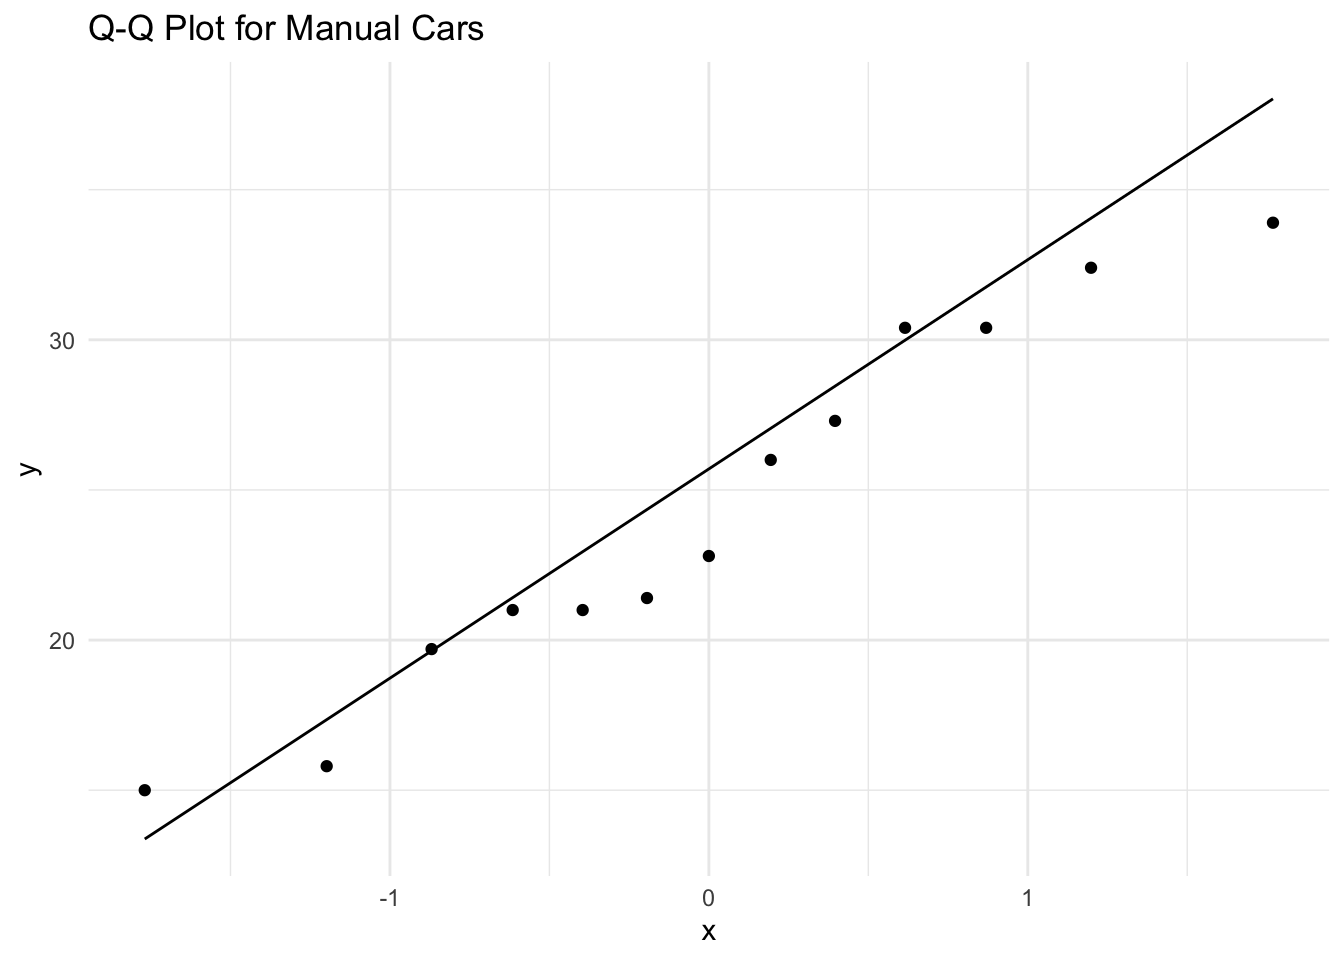
Perform t-test
# Perform the t-test to compare mpg between automatic and manual cars
t_test_result <- t.test(mpg ~ am, data = data)

# Display the t-test result
print(t_test_result)
##
## Welch Two Sample t-test
##
## data: mpg by am
## t = -3.7671, df = 18.332, p-value = 0.001374
## alternative hypothesis: true difference in means between group Automatic and group Manual is not equal to 0
## 95 percent confidence interval:
## -11.280194 -3.209684
## sample estimates:
## mean in group Automatic mean in group Manual
## 17.14737 24.39231Step 5: Interpretation of Results
# Display the 95% confidence interval for the difference in means
t_test_result$conf.int
## [1] -11.280194 -3.209684
## attr(,"conf.level")
## [1] 0.95Step 6: Conclusion
Since the p-value (0.00137) is less than the significance level (typically 0.05), we reject the null hypothesis. There is sufficient evidence to conclude that there is a significant difference in mean mpg between automatic and manual cars, with manual cars having better fuel efficiency on average.